This case study highlights how The Wine Group decreased electricity demand costs by selecting the best network tariff for its winery – (Applies to ‘large’ >160MWh/yr customers.)
The Wine Group (TWG) is one of the largest producers of wine in the world. Like many South Australian wineries, TWG Loxton Winery (Figure 1) is dealing with rising energy prices and the hard task of trying to minimise electricity costs.
TWG Loxton has three electricity meters which supply power to different areas of their winery. These supplies are categorised as large business supplies as they each use more than 160MWh of electricity per annum. The cost of electricity from a large business supply is based not only on the electricity consumption (kWh) but also the electricity demand (kVA).
Many wineries assume that these costs are fixed. However, wineries can choose how they are charged for demand. There are two types of demand tariffs available to choose from, either Annual Agreed Demand or Monthly Actual Demand.
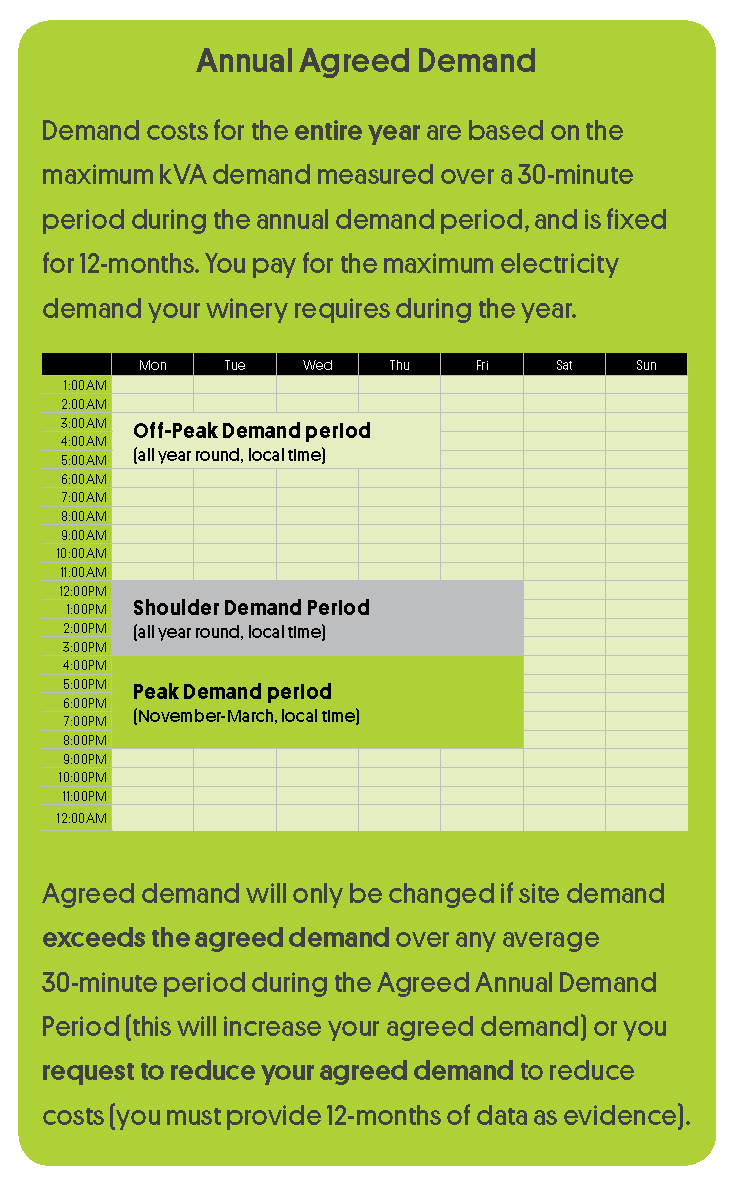
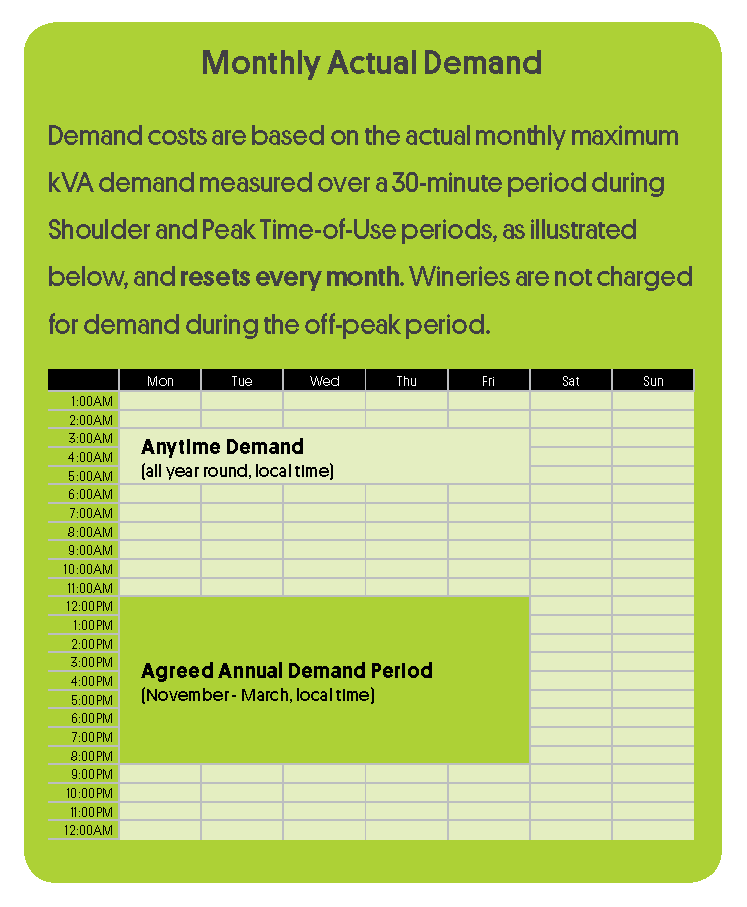
Throughout 2017 and 2018, TWG Loxton had two supplies on annual agreed tariffs and one supply on a monthly actual tariff.
TWG Loxton observed that although it had put in place technologies to reduce their maximum demand and create a flat demand profile (Figure 2), the demand costs had stayed consistent.
To better understand the issue, TWG Loxton participated in the Winery Energy Demand Management Program, funded by Green Industries South Australia (GISA) and managed by the South Australian Wine Industry Association (SAWIA) to engage energy experts 2XE and assess the winery’s electricity interval meter data and demand costs for the last 2 years.
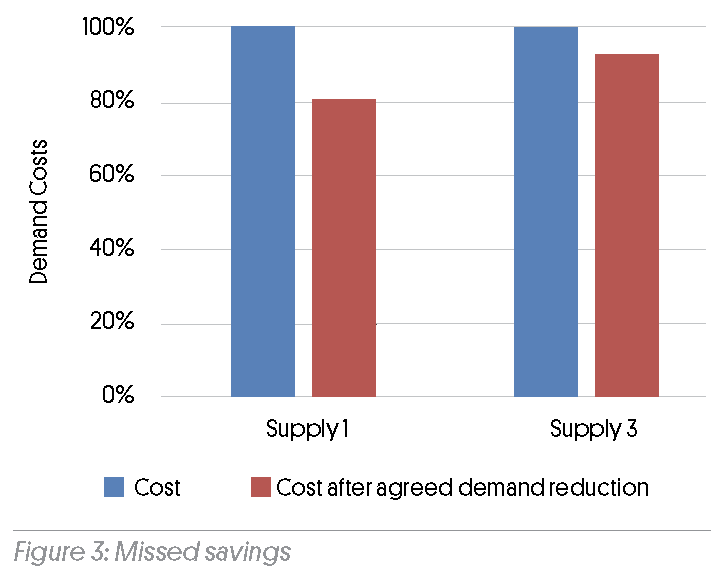 TWG had successfully reduced maximum demand but hadn’t contacted its energy retailer to arrange for a reduction in Agreed Demand. This meant missing out on 20% of demand savings for two of the supplies.
TWG has since contacted its retailer to organise for the agreed demand be reduced.
TWG will be paying closer attention to demand tariffs in the future through Tariff Analyses. This will utilise historical demand data and future tariff rates outlined by SA Power Networks (SAPN) to determine which tariff will be most cost-effective for the following year.
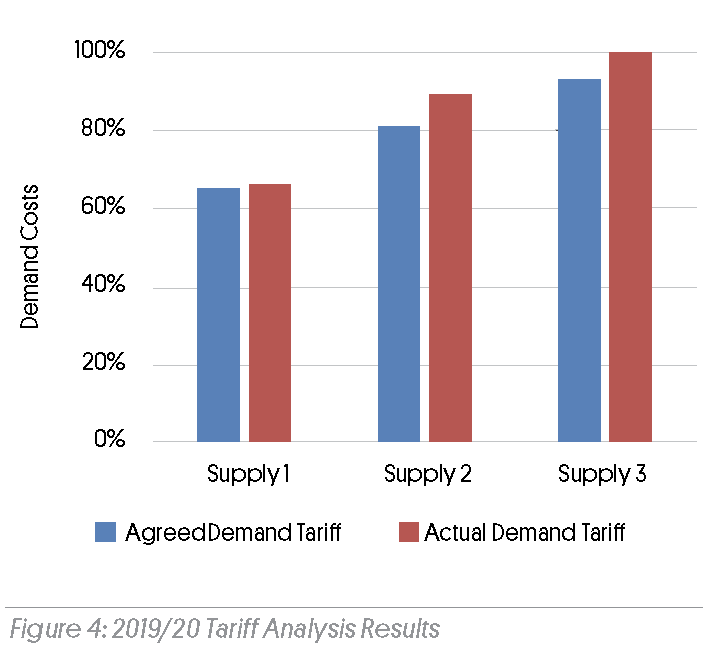 For the 2019-20 SAPN tariffs (Figure 4), it was more cost-effective to have all supplies on an Agreed demand tariff.
By contacting its retailer and shifting all supplies onto an Annual Agreed Tariff, TWG Loxton can reduce demand costs for 2019-20 by 6.6%.
Sometimes lower demand costs are just one phone call away.
TWG were also able to identify a range of other opportunities to reduce its demand and costs. TWG’s energy profile indicates that electricity use is low between 1am and 7am during vintage. This provides an excellent opportunity for load shifting and overchilling at night to reduce the energy load and costs during the day and increasing energy efficiency.
The savings from load shifting are expected to be:
- Expected energy savings 50 MWh per annum)
- Expected cost savings $21,000 per annum
- Return on investment <1 year
- GHG emissions savings 22.5 tCO2e p.a.
- KVA load eliminated from grid 50-100kVA